move the mouse pointer over that image.
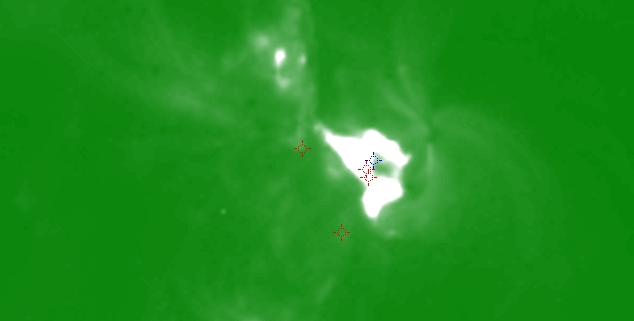
| Evolution of sunspot group NOAA 10759 and positions of flares in it animated by using the data of SOHO/MDI Debrecen Data (SDD) sunspot catalogue (lower panel, middle, ellipses with positions and areas corresponding to the relevant data of spots in SDD and with grey-scale colour coding of the magnetic polarities corresponding to that of the magnetograms), SOHO/MDI continuum images (lower panel, left) and magnetograms (lower panel, right), SOHO/EIT images (upper panel, middle), GOES and RHESSI flare data (red and blue symbols) observed within the interval around the time of SDD data. |
|
When you want to zoom in on one of the images, simply move the mouse pointer over that image. |
 |
| Year | Month | Day | Hour | Min | Sec | NOAA | Proj.U | Proj.WS | Corr.U | Corr.WS | B | L | LCM | Pos.angle | r | MU | MP |
|---|---|---|---|---|---|---|---|---|---|---|---|---|---|---|---|---|---|
| 2005 | 05 | 12 | 01 | 35 | 32 | 10759 | 153 | 892 | 91 | 526 | 11.96 | 56.73 | -29.37 | 62.36 | 0.5437 | 1103.1 | 416.0 |
| Flare | Date | Start | Peak | End | Dur [s] | Peak [c/s] | Total Counts | Energy [keV] | X pos [asec] | Y pos [asec] | Radial [asec] | B [deg] | L [deg] | Flags |
|---|---|---|---|---|---|---|---|---|---|---|---|---|---|---|
| 5051230 | 12-May-2005 | 01:05:56 | 01:07:14 | 01:08:36 | 160 | 3 | 1390 | 6-12 | -479 | 222 | 528 | 10.66 | 54.78 | A0 DF P1 |
| 5051201 | 12-May-2005 | 01:10:16 | 01:13:02 | 01:35:16 | 1500 | 348 | 472978 | 50-100 | -476 | 217 | 523 | 10.35 | 54.97 | a0 A1 DF P1 |
| 5051249 | 12-May-2005 | 01:35:16 | 01:37:34 | 01:37:40 | 144 | 1 | 838 | 6-12 | -512 | 235 | 563 | 11.53 | 52.04 | A0 DF P1 PE |
| 5051231 | 12-May-2005 | 02:14:04 | 02:15:02 | 02:18:24 | 260 | 168 | 187416 | 6-12 | -477 | 183 | 511 | 8.28 | 54.53 | A0 DF P1 |
| Date | Start | Peak | End | Classification | B [deg] | LCM [deg] |
|---|---|---|---|---|---|---|
| 12-May-2005 | 01:10 | 01:13 | 01:20 | C9.4 | 11 | -31 |

