move the mouse pointer over that image.
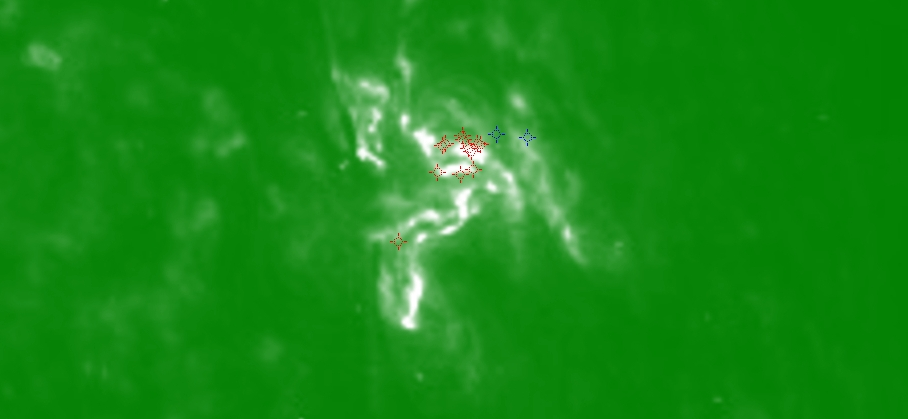
| Evolution of sunspot group NOAA 10720 and positions of flares in it animated by using the data of SOHO/MDI Debrecen Data (SDD) sunspot catalogue (lower panel, middle, ellipses with positions and areas corresponding to the relevant data of spots in SDD and with grey-scale colour coding of the magnetic polarities corresponding to that of the magnetograms), SOHO/MDI continuum images (lower panel, left) and magnetograms (lower panel, right), SOHO/EIT images (upper panel, middle), GOES and RHESSI flare data (red and blue symbols) observed within the interval around the time of SDD data. |
|
When you want to zoom in on one of the images, simply move the mouse pointer over that image. |
 |
| Year | Month | Day | Hour | Min | Sec | NOAA | Proj.U | Proj.WS | Corr.U | Corr.WS | B | L | LCM | Pos.angle | r | MU | MP |
|---|---|---|---|---|---|---|---|---|---|---|---|---|---|---|---|---|---|
| 2005 | 01 | 19 | 01 | 35 | 32 | 10720 | 395 | 2627 | 290 | 1926 | 12.63 | 180.07 | 44.36 | 292.21 | 0.7384 | -107.4 | -181.1 |
| Flare | Date | Start | Peak | End | Dur [s] | Peak [c/s] | Total Counts | Energy [keV] | X pos [asec] | Y pos [asec] | Radial [asec] | B [deg] | L [deg] | Flags |
|---|---|---|---|---|---|---|---|---|---|---|---|---|---|---|
| 5011926 | 19-Jan-2005 | 01:31:28 | 01:35:50 | 01:38:28 | 420 | 31 | 52211 | 12-25 | 684 | 310 | 751 | 15.56 | 182.54 | A0 DF P1 |
| 5011927 | 19-Jan-2005 | 01:44:16 | 01:45:22 | 01:46:56 | 160 | 5 | 3986 | 6-12 | 675 | 290 | 735 | 14.22 | 181.25 | A0 DF P1 |
| 5011928 | 19-Jan-2005 | 01:53:56 | 01:59:10 | 02:07:44 | 828 | 12 | 28996 | 12-25 | 683 | 306 | 749 | 15.29 | 182.15 | A0 DF P1 PE |
| 5011978 | 19-Jan-2005 | 02:07:44 | 02:10:54 | 02:16:32 | 528 | 8 | 15201 | 12-25 | 688 | 293 | 748 | 14.49 | 182.27 | A0 DF DR P1 PE |
| 5011929 | 19-Jan-2005 | 02:16:32 | 02:19:38 | 02:27:40 | 668 | 8 | 17967 | 12-25 | 683 | 314 | 752 | 15.81 | 182.12 | A0 DF P1 |
| 5011919 | 19-Jan-2005 | 02:31:40 | 02:34:26 | 02:37:00 | 320 | 23 | 11511 | 12-25 | 647 | 247 | 693 | 11.36 | 177.73 | A0 DF P1 PE |
| 5011905 | 19-Jan-2005 | 03:04:52 | 03:13:38 | 03:18:52 | 840 | 3184 | 5702040 | 25-50 | 679 | 290 | 739 | 14.24 | 180.81 | A0 DF P1 |
| 5011979 | 19-Jan-2005 | 03:18:52 | 03:24:06 | 03:48:28 | 1776 | 2895 | 10846398 | 12-25 | 696 | 310 | 762 | 15.63 | 182.69 | A0 DF P1 PE |
| 5011980 | 19-Jan-2005 | 03:48:28 | 03:55:46 | 04:11:32 | 1384 | 1433 | 3910043 | 12-25 | 707 | 302 | 769 | 15.18 | 183.30 | A0 DF P1 PE |
| 5011933 | 19-Jan-2005 | 04:11:32 | 04:14:18 | 04:15:32 | 240 | 161 | 168430 | 6-12 | 695 | 307 | 760 | 15.42 | 182.07 | A0 DF P1 PE |
| 5011981 | 19-Jan-2005 | 04:43:00 | 04:43:02 | 04:43:08 | 8 | 45 | 2095 | 6-12 | 699 | 305 | 763 | 15.32 | 182.15 | A0 DF P1 |
| 5011934 | 19-Jan-2005 | 05:04:56 | 05:20:02 | 05:47:20 | 2544 | 352 | 1309295 | 12-25 | 728 | 305 | 789 | 15.51 | 184.70 | a0 A1 DF DR P1 PE |
| Date | Start | Peak | End | Classification | B [deg] | LCM [deg] |
|---|---|---|---|---|---|---|
| 19-Jan-2005 | 03:10 | 03:24 | 03:37 | C1.8 | 16 | 49 |
| 19-Jan-2005 | 05:10 | 05:26 | 05:35 | C7.2 | 16 | 52 |

