
move the mouse pointer over that image.
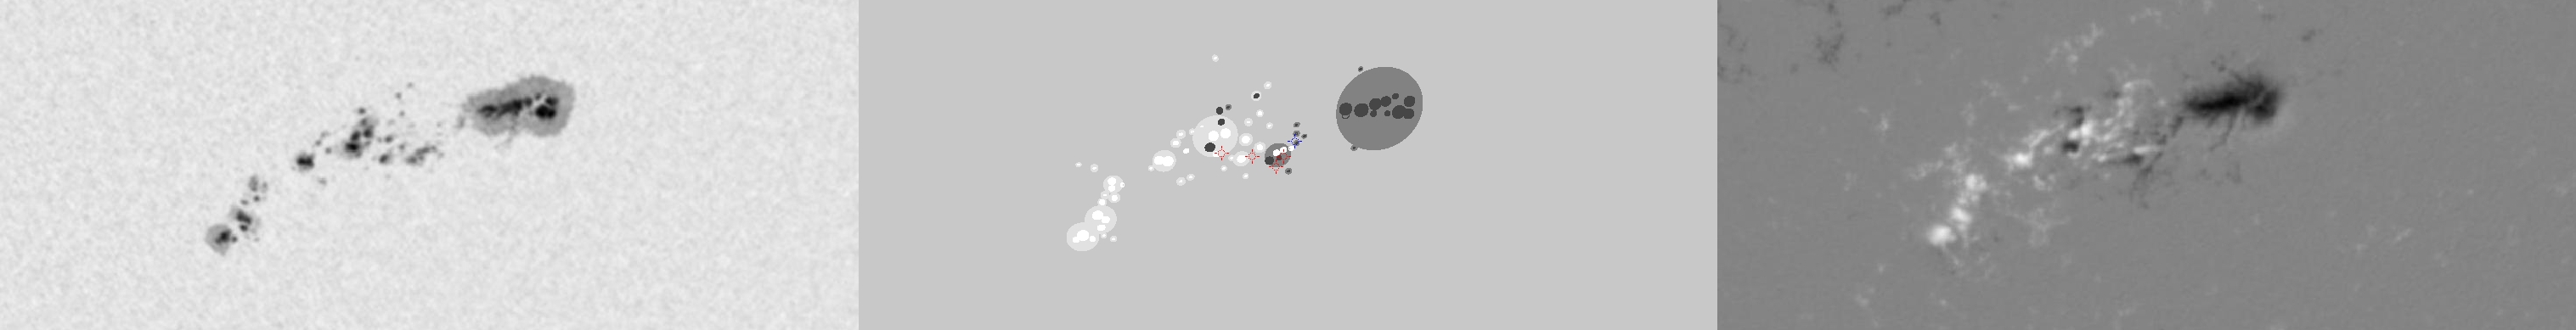
| Evolution of sunspot group NOAA 10226 and positions of flares in it animated by using the data of SOHO/MDI Debrecen Data (SDD) sunspot catalogue (lower panel, middle, ellipses with positions and areas corresponding to the relevant data of spots in SDD and with grey-scale colour coding of the magnetic polarities corresponding to that of the magnetograms), SOHO/MDI continuum images (lower panel, left) and magnetograms (lower panel, right), SOHO/EIT images (upper panel, middle), GOES and RHESSI flare data (red and blue symbols) observed within the interval around the time of SDD data. |
|
When you want to zoom in on one of the images, simply move the mouse pointer over that image. |
 |
| Year | Month | Day | Hour | Min | Sec | NOAA | Proj.U | Proj.WS | Corr.U | Corr.WS | B | L | LCM | Pos.angle | r | MU | MP |
|---|---|---|---|---|---|---|---|---|---|---|---|---|---|---|---|---|---|
| 2002 | 12 | 18 | 22 | 23 | 32 | 10226 | 364 | 2035 | 209 | 1160 | -26.73 | 129.57 | 15.12 | 208.32 | 0.4982 | -249.3 | -150.6 |
| Flare | Date | Start | Peak | End | Dur [s] | Peak [c/s] | Total Counts | Energy [keV] | X pos [asec] | Y pos [asec] | Radial [asec] | B [deg] | L [deg] | Flags |
|---|---|---|---|---|---|---|---|---|---|---|---|---|---|---|
| 21218119 | 18-Dec-2002 | 21:34:28 | 21:36:34 | 21:41:56 | 448 | 384 | 273792 | 12-25 | 224 | -438 | 492 | -28.27 | 129.04 | A0 DF DR GE P1 |
| 2121894 | 18-Dec-2002 | 22:20:04 | 22:23:58 | 22:29:08 | 544 | 592 | 593568 | 12-25 | 242 | -430 | 493 | -27.73 | 129.79 | A0 DF DR P1 |
| 2121895 | 18-Dec-2002 | 23:10:48 | 23:15:42 | 23:32:00 | 1272 | 104 | 306792 | 6-12 | 210 | -428 | 477 | -27.62 | 127.07 | A0 DF DR P1 |
| 2121896 | 18-Dec-2002 | 23:36:24 | 23:37:14 | 23:40:48 | 264 | 104 | 56952 | 6-12 | 238 | -430 | 492 | -27.74 | 128.84 | A0 DF DR P1 |
| Date | Start | Peak | End | Classification | B [deg] | LCM [deg] |
|---|---|---|---|---|---|---|
| 19-Dec-2002 | 00:29 | 00:35 | 00:38 | C2.7 | -27 | 17 |

