move the mouse pointer over that image.
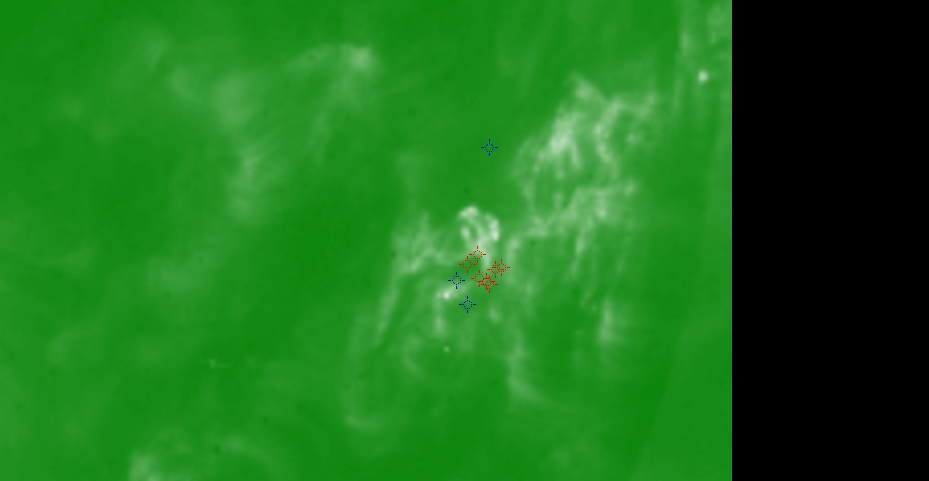
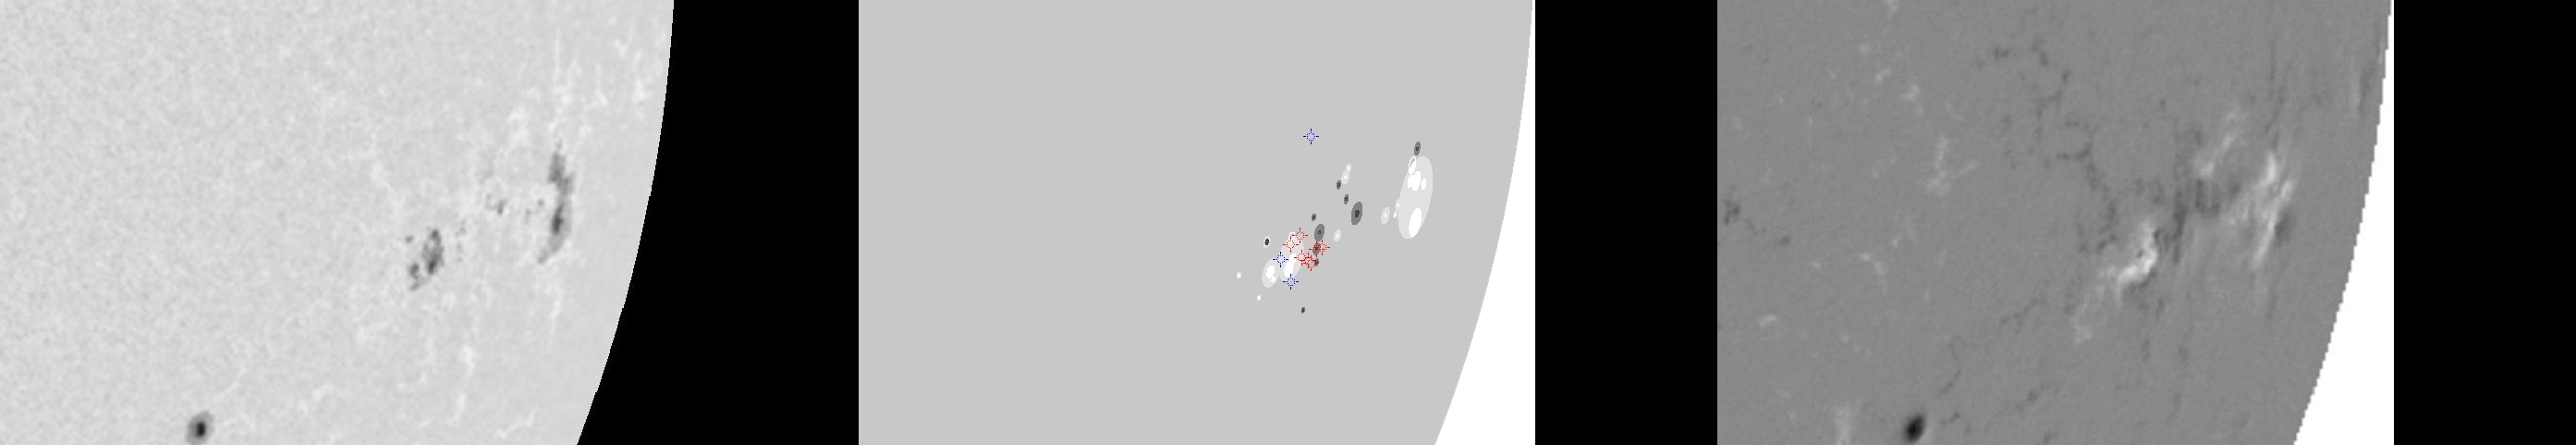
| Evolution of sunspot group NOAA 10180 and positions of flares in it animated by using the data of SOHO/MDI Debrecen Data (SDD) sunspot catalogue (lower panel, middle, ellipses with positions and areas corresponding to the relevant data of spots in SDD and with grey-scale colour coding of the magnetic polarities corresponding to that of the magnetograms), SOHO/MDI continuum images (lower panel, left) and magnetograms (lower panel, right), SOHO/EIT images (upper panel, middle), GOES and RHESSI flare data (red and blue symbols) observed within the interval around the time of SDD data. |
|
When you want to zoom in on one of the images, simply move the mouse pointer over that image. |
 |
| Year | Month | Day | Hour | Min | Sec | NOAA | Proj.U | Proj.WS | Corr.U | Corr.WS | B | L | LCM | Pos.angle | r | MU | MP |
|---|---|---|---|---|---|---|---|---|---|---|---|---|---|---|---|---|---|
| 2002 | 11 | 11 | 12 | 47 | 33 | 10180 | 123 | 636 | 153 | 764 | -10.45 | 311.77 | 64.40 | 256.88 | 0.9093 | 561.6 | 176.5 |
| Flare | Date | Start | Peak | End | Dur [s] | Peak [c/s] | Total Counts | Energy [keV] | X pos [asec] | Y pos [asec] | Radial [asec] | B [deg] | L [deg] | Flags |
|---|---|---|---|---|---|---|---|---|---|---|---|---|---|---|
| 2111127 | 11-Nov-2002 | 12:31:40 | 12:50:10 | 13:25:28 | 3228 | 107 | 475551 | 12-25 | 826 | -221 | 855 | -11.69 | 307.54 | a0 A1 DF P1 |
| 2111183 | 11-Nov-2002 | 13:26:28 | 13:32:18 | 13:35:24 | 536 | 10 | 18213 | 12-25 | 818 | -212 | 845 | -11.08 | 305.93 | A0 DF P1 |
| 21111115 | 11-Nov-2002 | 13:35:24 | 13:37:34 | 13:38:08 | 164 | 13 | 5686 | 12-25 | 829 | -221 | 858 | -11.72 | 307.51 | A0 DF P1 |
| 2111131 | 11-Nov-2002 | 14:07:52 | 14:42:58 | 15:06:32 | 3520 | 152 | 559981 | 25-50 | 822 | -217 | 851 | -11.42 | 305.90 | a0 A1 DF P1 |
| 21111116 | 11-Nov-2002 | 15:06:32 | 15:14:02 | 15:15:00 | 508 | 118 | 76315 | 12-25 | 833 | -225 | 863 | -12.00 | 307.26 | a0 A1 DF EE P1 |
| 2111134 | 11-Nov-2002 | 15:43:44 | 15:44:14 | 15:59:28 | 944 | 534 | 692008 | 12-25 | 841 | -227 | 871 | -12.18 | 308.15 | A0 a1 DF P1 |
| 21111117 | 11-Nov-2002 | 15:59:28 | 16:19:42 | 16:49:52 | 3024 | 291 | 2251317 | 12-25 | 847 | -228 | 877 | -12.30 | 308.71 | a0 A1 DF P1 |
| Date | Start | Peak | End | Classification | B [deg] | LCM [deg] |
|---|---|---|---|---|---|---|
| 11-Nov-2002 | 12:25 | 12:54 | 13:10 | C7.1 | -12 | 57 |
| 11-Nov-2002 | 14:37 | 14:45 | 14:55 | C6.5 | -07 | 59 |
| 11-Nov-2002 | 15:11 | 16:20 | 16:45 | M1.8 | -13 | 60 |

