move the mouse pointer over that image.
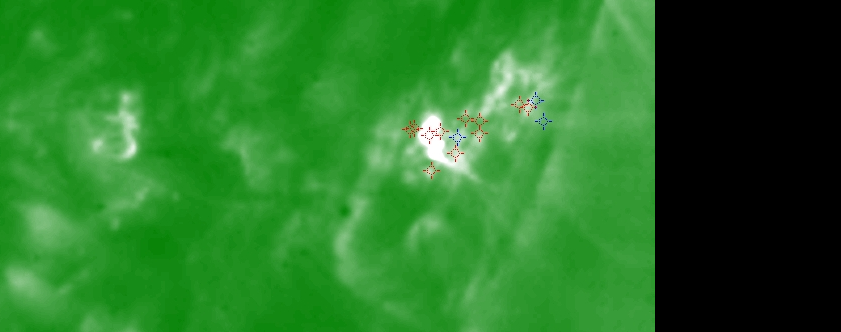
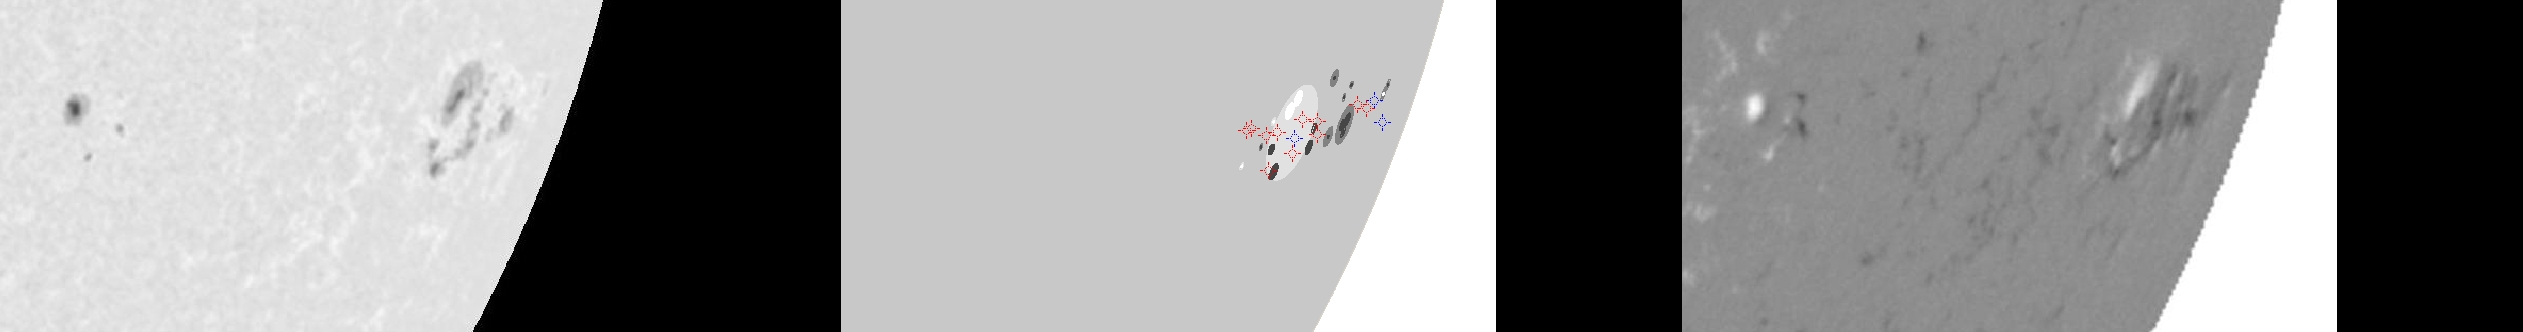
| Evolution of sunspot group NOAA 10017 and positions of flares in it animated by using the data of SOHO/MDI Debrecen Data (SDD) sunspot catalogue (lower panel, middle, ellipses with positions and areas corresponding to the relevant data of spots in SDD and with grey-scale colour coding of the magnetic polarities corresponding to that of the magnetograms), SOHO/MDI continuum images (lower panel, left) and magnetograms (lower panel, right), SOHO/EIT images (upper panel, middle), GOES and RHESSI flare data (red and blue symbols) observed within the interval around the time of SDD data. |
|
When you want to zoom in on one of the images, simply move the mouse pointer over that image. |
 |
| Year | Month | Day | Hour | Min | Sec | NOAA | Proj.U | Proj.WS | Corr.U | Corr.WS | B | L | LCM | Pos.angle | r | MU | MP |
|---|---|---|---|---|---|---|---|---|---|---|---|---|---|---|---|---|---|
| 2002 | 07 | 04 | 09 | 34 | 32 | 10017 | 66 | 493 | 96 | 711 | -18.52 | 233.50 | 67.43 | 248.86 | 0.9391 | 0.3 | -5.7 |
| Flare | Date | Start | Peak | End | Dur [s] | Peak [c/s] | Total Counts | Energy [keV] | X pos [asec] | Y pos [asec] | Radial [asec] | B [deg] | L [deg] | Flags |
|---|---|---|---|---|---|---|---|---|---|---|---|---|---|---|
| 2070463 | 4-Jul-2002 | 06:30:52 | 06:33:46 | 06:44:12 | 800 | 38 | 57669 | 12-25 | 802 | -354 | 877 | -20.23 | 229.54 | a0 A1 DF GE P1 PE |
| 2070465 | 4-Jul-2002 | 06:51:20 | 06:51:30 | 07:00:56 | 576 | 1 | 554 | 6-12 | 836 | -323 | 897 | -18.44 | 233.11 | A0 DF GS P1 |
| 2070470 | 4-Jul-2002 | 07:27:04 | 07:32:26 | 07:34:08 | 424 | 172 | 53314 | 50-100 | 867 | -312 | 922 | -18.01 | 237.88 | a0 A1 DF EE P1 |
| 2070471 | 4-Jul-2002 | 07:54:20 | 07:55:02 | 07:59:28 | 308 | 29 | 34320 | 6-12 | 875 | -314 | 929 | -18.24 | 239.63 | A0 DF P1 |
| 2070499 | 4-Jul-2002 | 07:59:28 | 08:03:26 | 08:06:52 | 444 | 28 | 46528 | 6-12 | 844 | -330 | 906 | -18.97 | 234.21 | A0 DF P1 |
| 20704100 | 4-Jul-2002 | 08:06:52 | 08:08:38 | 08:11:12 | 260 | 32 | 34880 | 6-12 | 829 | -342 | 897 | -19.64 | 232.24 | A0 DF P1 |
| 2070448 | 4-Jul-2002 | 09:30:36 | 09:31:34 | 09:34:48 | 252 | 76 | 50142 | 6-12 | 814 | -325 | 877 | -18.39 | 228.31 | A0 DF P1 |
| 20704101 | 4-Jul-2002 | 09:34:48 | 09:37:18 | 09:41:56 | 428 | 136 | 99504 | 12-25 | 812 | -326 | 875 | -18.44 | 228.01 | A0 DF P1 |
| 2070406 | 4-Jul-2002 | 09:41:56 | 09:45:26 | 09:48:28 | 392 | 256 | 101064 | 12-25 | 831 | -327 | 893 | -18.66 | 230.89 | A0 DF GE P1 PE |
| 2070426 | 4-Jul-2002 | 10:15:20 | 10:15:26 | 10:23:24 | 484 | 1456 | 1175040 | 12-25 | 828 | -329 | 891 | -18.76 | 230.23 | A0 DF GS P1 |
| 20704103 | 4-Jul-2002 | 10:41:16 | 10:42:38 | 10:46:08 | 292 | 108 | 85704 | 6-12 | 852 | -318 | 909 | -18.25 | 233.52 | A0 DF P1 |
| Date | Start | Peak | End | Classification | B [deg] | LCM [deg] |
|---|---|---|---|---|---|---|
| 4-Jul-2002 | 07:27 | 07:34 | 07:39 | M1.1 | -19 | 77 |
| 4-Jul-2002 | 10:08 | 10:13 | 10:17 | C2.4 | -19 | 67 |
| 4-Jul-2002 | 10:45 | 10:53 | 11:11 | C2.6 | -18 | 76 |

