move the mouse pointer over that image.
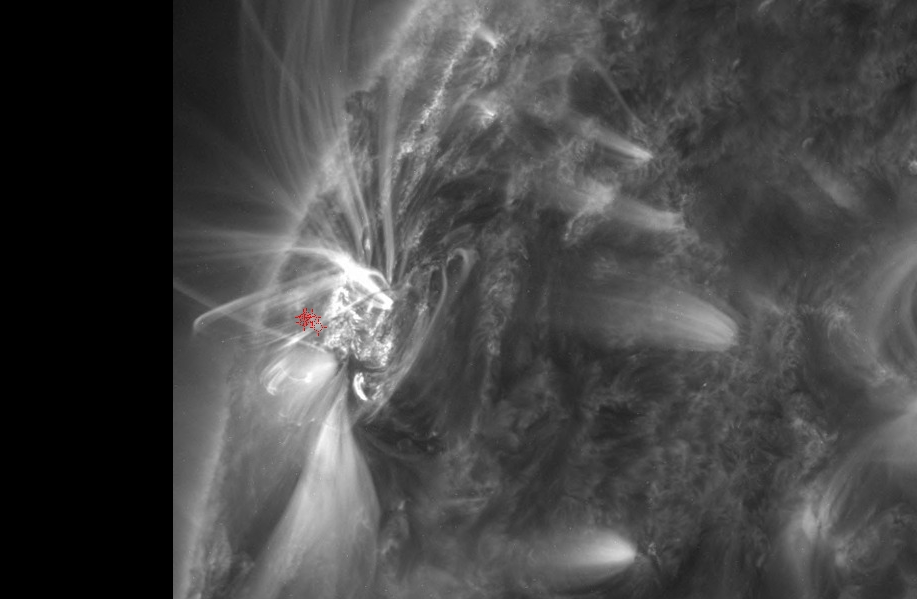
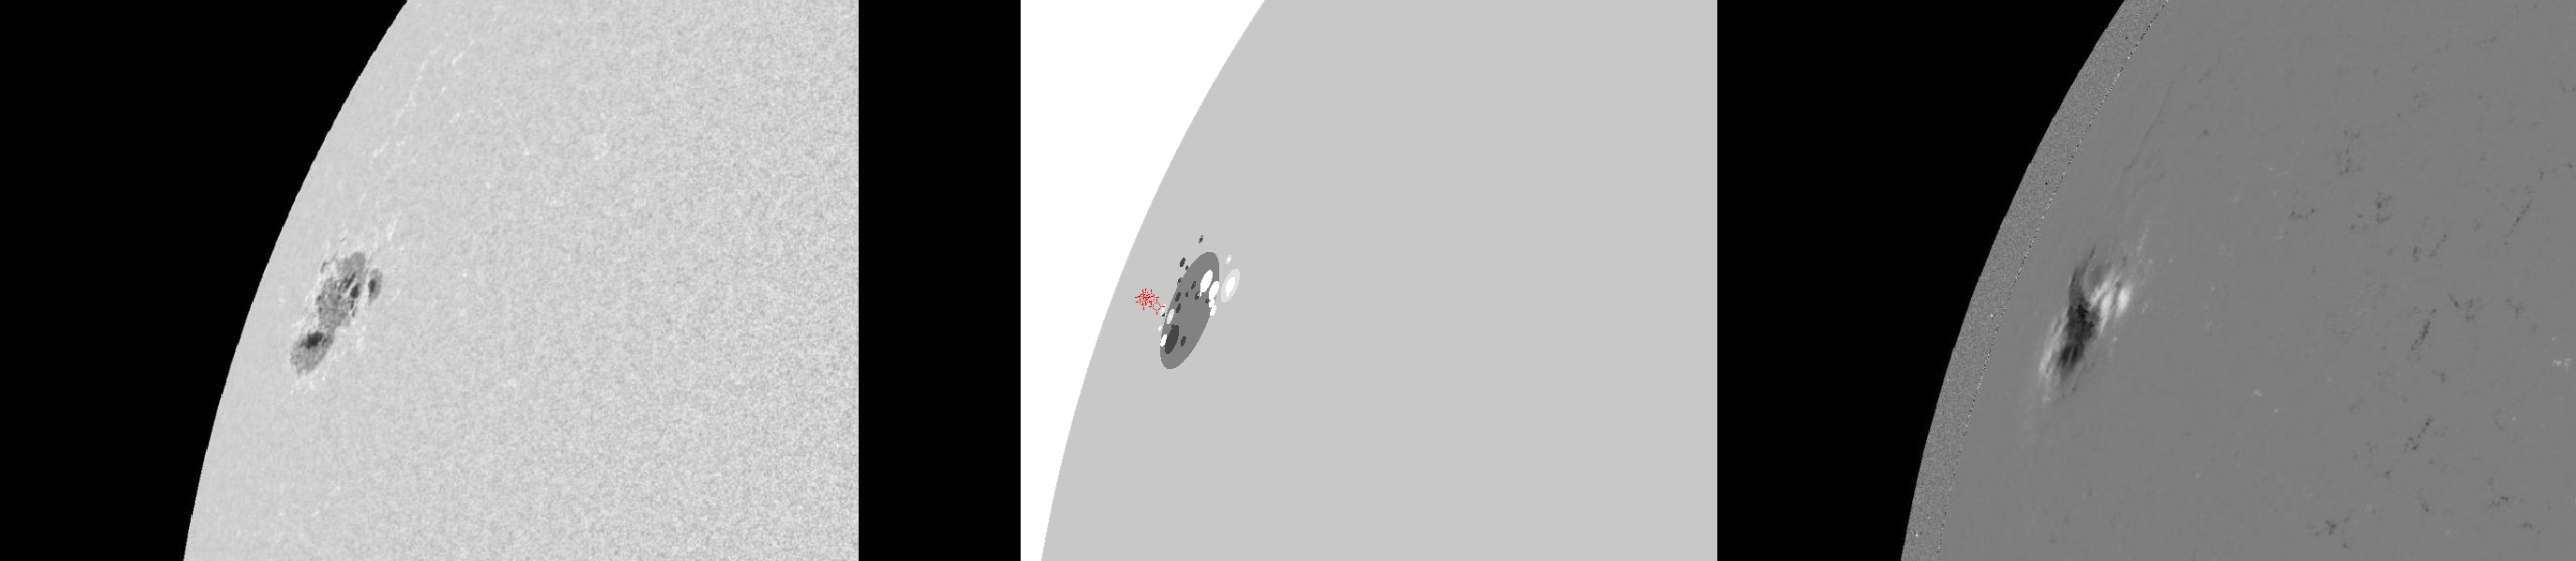
| Evolution of sunspot group NOAA 11429 and positions of flares in it animated by using the data of SDO/HMI Debrecen Data (HMIDD) sunspot catalogue (lower panel, middle, ellipses with positions and areas corresponding to the relevant data of spots in SDO and with grey-scale colour coding of the magnetic polarities corresponding to that of the magnetograms), SDO/HMI continuum images (lower panel, left) and magnetograms (lower panel, right), SDO/AIA images (upper panel, middle), GOES and RHESSI flare data (red and blue symbols) observed within the interval around the time of HMIDD data. |
|
When you want to zoom in on one of the images, simply move the mouse pointer over that image. |
 |
| Year | Month | Day | Hour | Min | Sec | NOAA | Proj.U | Proj.WS | Corr.U | Corr.WS | B | L | LCM | Pos.angle | r | MU | MP |
|---|---|---|---|---|---|---|---|---|---|---|---|---|---|---|---|---|---|
| 2012 | 03 | 04 | 02 | 58 | 59 | 11429 | 118 | 684 | 176 | 1042 | 17.31 | 299.29 | -67.25 | 68.77 | 0.9456 | 22.8 | -203.0 |
| Flare | Date | Start | Peak | End | Dur [s] | Peak [c/s] | Total Counts | Energy [keV] | X pos [asec] | Y pos [asec] | Radial [asec] | B [deg] | L [deg] | Flags |
|---|---|---|---|---|---|---|---|---|---|---|---|---|---|---|
| 12030408 | 4-Mar-2012 | 02:30:16 | 02:31:14 | 02:39:16 | 540 | 92 | 63880 | 6-12 | -860 | 334 | 923 | 18.07 | -64.65 | A0 DF P1 PE |
| 12030409 | 4-Mar-2012 | 02:40:44 | 02:43:14 | 02:45:00 | 256 | 44 | 32380 | 6-12 | -868 | 338 | 932 | 18.59 | -66.89 | A0 DF P1 PE |
| 12030443 | 4-Mar-2012 | 02:45:00 | 02:45:42 | 02:48:36 | 216 | 28 | 23620 | 6-12 | -868 | 341 | 933 | 18.81 | -67.16 | A0 DF P1 PE |
| 12030415 | 4-Mar-2012 | 02:48:36 | 02:51:22 | 02:52:48 | 252 | 36 | 32600 | 6-12 | -866 | 342 | 932 | 18.82 | -66.80 | A0 DF DR P1 PE |
| 12030416 | 4-Mar-2012 | 03:24:44 | 03:25:10 | 03:26:20 | 96 | 46 | 10240 | 6-12 | -859 | 342 | 925 | 18.62 | -65.49 | A0 DF P1 PE |
| Date | Start | Peak | End | Classification | B [deg] | LCM [deg] |
|---|---|---|---|---|---|---|
| No data |

